
“If you fail to plan, you plan to fail” – the words of Benjamin Franklin are applicable in trading, dividing traders into two large groups. The first one consists of those who use a trading plan, the second one consists of those who lose. We bet you’d like to be in the first one! Thus, planning is one of the key issues along with tech analysis, money and risk management, and traders’ psychology issues.
So, a trading plan is an instruction that describes your actions in detail before, during and after each trade. If you are an experienced trader, you might have noticed that there are dozens of ways to act when something goes wrong. A good trading plan includes as many of them as possible to make you as powerful as possible. Thus, it is recommended to develop a control list for your trades to rely on. By the way, this list often serves as a base for your risk management system development that is a powerful tool that makes traders win even in unfavorable conditions.
Control list is, firstly (macro-level), the description of your trading workflow: when you trade, how much time you spend, when it is time to stop and so on. Secondly (micro-level), it’s a description of each trade with possible scenarios: when to open and close a trade (read here why it’s so important to close trades timely), what setup to apply, when to change the position size and so on. Hence, all your actions are planned in advance, providing you with a step-by-step guide for each trade. The “control points” of possible trades and overall trading style are up to the trader, but here is a template that can be used to develop your own trading plan.

Possible recommended points to mention in your plan are the following:
Overall market state: Never trade in chaos
First of all, decide when you trade and when you don’t. It’s indeed an essential point as sometimes it is better not to trade at all. Thus, keep in mind that when the market is wild (chaos) the majority of trading setups are likely to fail. Also, the market may play a bad joke before and after significant news, events and speeches of public figures. Remember:
“Buy on rumors and sell on the news.”
Emotional stability: Keep calm
Furthermore, pay attention to your personal emotional stability, keep in control of what you feel and what you do. Trading psychology should not be underestimated, therefore, figure out when your emotions may harm your trading results and exclude these periods from your trading plan. Set a rule to stop trading anytime you feel your emotions are taking over. You need good results, not a process!
Trading conditions & schedule: Stay disciplined
Besides, avoid sidetracking factors to stay concentrated and make the right decisions! Probably it would be wise to follow a schedule that will make your trading more systematized. This way, you will have certain “working hours” in appropriate conditions. Sounds more effective than trading all day long, when you are already tired, doesn’t it?
These rules may seem to be super simple, however, they play a considerable role.
So, you configured your trading time and other details that may influence your trading performance.
Thus, it is time to talk about setup for your trades.
Technical analysis: Follow chart patterns
Pay attention to technical analysis. Chart patterns might be a good setup to enter the market. Patterns are recognizable configurations of price movements that are based on previous market behavior: It’s well known that history repeats itself. Therefore, chart patterns can signalize a change in trend direction. There is no doubt that they won’t 100% predict the price movement, but still, they work and might be useful in ongoing trend identification. So, decide what patterns you use beforehand. Note that there are various patterns for different trading strategies and timeframes.
Trading indicators: Use signals for your help
Trading indicators can also be used as benchmarks of the market. To simplify, an indicator is a mathematical calculation based on price movement features. It is used to identify the price movements (they act as signals). The most widely used trading indicators are moving averages (MA), moving average convergence divergence (MACD), Relative strength index (RSI). Actually, there are plenty of them, and all of them may serve as an additional signal to enter (or quit) the market, increase or reduce the position size.

However, note that patterns and indicators are recommended to be used in a complex strategy. A single indicator will hardly ever help you to open a profitable trade. Thus, having a solid number of trades it is possible to figure out what patterns and indicators work better for you.
Monitor market phases: Trend is your friend!
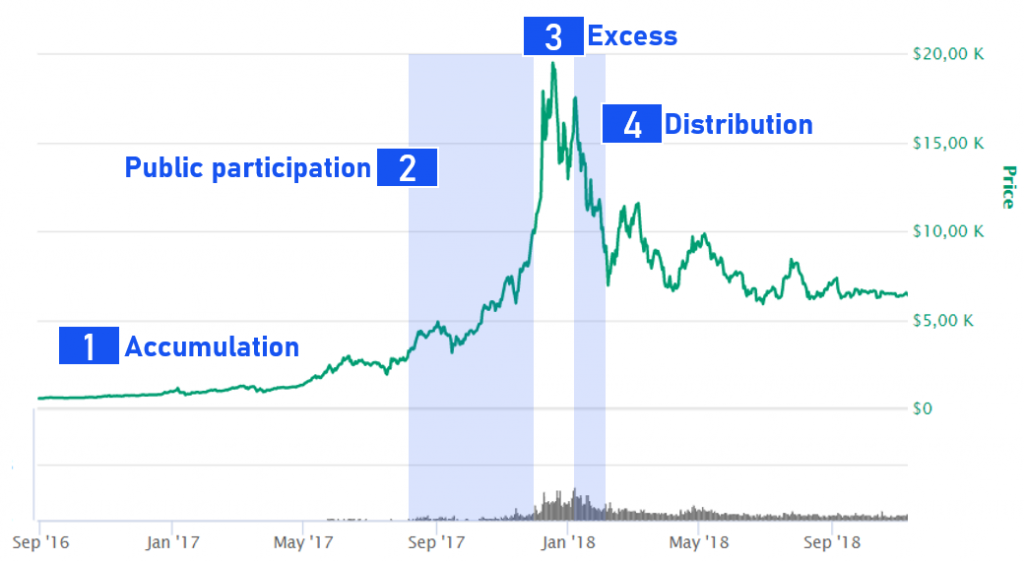
Accumulation, markup, distribution, decline — any trader is familiar with these market stages. Being aware of market stages, it is possible to identify a long term price movement, therefore, to invest in the right moment not depending on short and mid-term market fluctuations. Catch a long term trend!
Different time frames: Get a full picture
Also, it would be quite useful to observe the timeframes of the higher order. To illustrate, while trading mostly on a daily timeframe, use also weekly and even monthly time frames to see the global picture of the price dynamics to define if it is better to buy more or get rid of an asset. All this is better to consider before the scenario is happening and before you are rushing into a panic.
Strong levels: Beware of borders
One more thing to pay attention to is support and resistance levels. Consider strong levels within different periods of time (for example, 1, 2 and 6 months) to reveal possible “borders” for the price and use these levels in your strategy. For instance, work with strong levels rebounds or breakouts. Strong levels might give the info not only on entry points, but also on possible loss in case of unexpected price movement.
Asset peculiarities: They all are special
After the whole market analysis, review the particular asset (or asset class) you trade. The questions to answer are basic:
- What is the volatility rate?
- Is it correlated with any other asset (like in the case of Bitcoin and Ethereum)?
- What about long term dynamics?
- Are there any events that may cause a considerable price change?
This information will help to adjust your strategy or at least reinforce the confidence in it.
Thus, we discussed some key points to bear in mind while developing a trading plan. Note that your trading plan should be also based on your detailed trading statistics and also include risk management rules to limit your losses. This way, with a trading plan, you will be sure in every step you make, will have a plan B (emergency) and a list of control points that are easy to monitor, assess and improve.
Get some info on other essential steps to organize and improve your trading in the following articles:
- Multiply the deposit via self-awareness (1)
- Multiply the deposit with the statistics analysis (2)
- Multiply the deposit with strategy optimization (3)
Hence, it looks like the most interesting and influential part of trading is to develop a reliable trading plan. What you have to do after is just to follow it and enjoy the profits! Also get some tips on building an investment strategy here!
Join our social media to stay updated and get more articles on trading and investing:
Telegram: https://t.me/bitinsurecom
Facebook: https://www.facebook.com/bitinsure
Twitter: https://twitter.com/bitinsure_news
")
")

