
In this article we continue discussing key trading performance metrics that contribute to your trading strategy all-round assessment, resulting in crucial improvements and constantly increasing profitability. Why? Because math is an extremely valuable tool for traders for long-term success and profitability.
What is essential to remind you from the previous article is that there are two pillars of successful progressive trading that are:
- Precise recording of trading statistics (manually and/or automatically),
- Calculation of additional trading performance metrics.
By completing these actions, you get an idea of your trading performance and a comprehensive picture of its efficiency via key trading metrics that provide you with valuable insights into your strengths and weaknesses. Among these metrics, there are profit factor (discussed in a previous article), maximum drawdown, total, and average net profit, etc. In this article, we are covering the maximum drawdown, one of the most essential risk assessment indicators.
Maximum drawdown (MDD) is a metric that means a peak-to-trough decline of your deposit (before a new high is reached) during a particular period of time. Simply, the maximum losses you suffered. It is calculated as:

And normally is presented in percentage. This way, we get a percentage of your overall losses from your maximum deposit before a new peak is reached. The metric tells us about a risk level of your strategy and it is a must for adequate trading strategy evaluation because drawdowns are natural for trading (but note that losing trades are a serious threat for your deposit, therefore, learn how to deal with losses in the right way). Any winning strategy includes losses! Your business here is to evaluate and control them in a way to increase your profits. And MDD is one of the tools to do this.
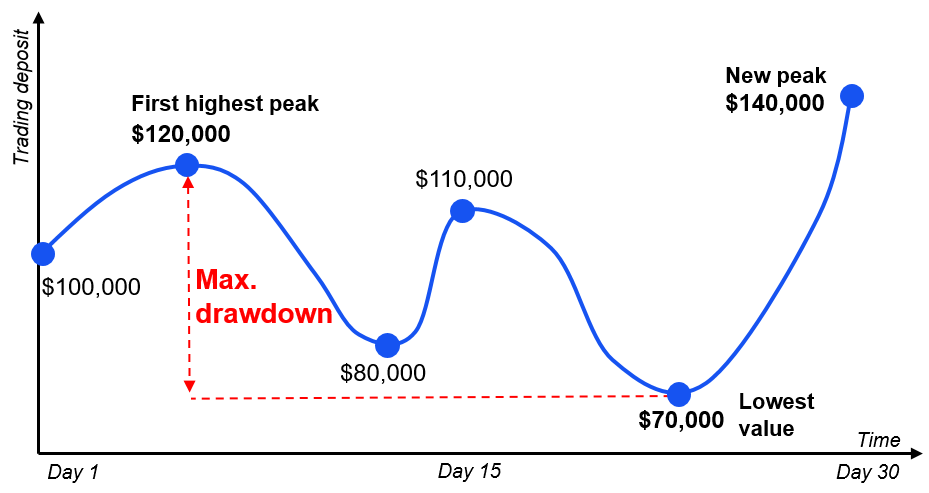
To illustrate, you started trading with a deposit of $100,000. You were quite successful and increased the deposit to $120,000. After that, you had some fluctuations with the minimum value of $70,000. Finally, you managed to gain and now have a deposit of $140,000.
In this case, the maximum drawdown is:
MDD = ($120,000- $70,000) / $120,000 = 41.67%
To clarify, we included into a formula a peak of $120,000 as the maximum value before the deposit reached its lowest point – $70,000. We do not consider a maximum peak of $140,000 in this calculation because it is a new maximum reached after the lowest value. As for $80,000 and $110,000 points, they are ignored as they are not the peaks or lows within this period.
So, this MDD means that the maximum loss you suffered from your maximum deposit was 41.67%. The question is if this number is normal?
How to assess MDD?
There is no clear answer, as the MDD assessment is closely related to your trading aims, strategy, deposit and risk tolerance. Hence, with these things kept in mind, regard the following issues that are the core while assessing MDD of the strategy:
- Drawdown magnitude. Be it 5% or 50%, evaluate if you can survive with this risk amount financially and morally to continue trading and earning? There are no earnings without survival! It’s essential.
- Drawdown duration. Pay attention to the time this drawdown lasts. A week and a year of drawdown make a difference. Decide if you will remain solvent during this period of time.
For your help: Generally, the max drawdown of 20% is considered to be an average normal (not that painful) value for the majority of traders, but it depends a lot.
However, take into account that MDD measures the overall largest loss without revealing the frequency of such losses. For instance, the strategy №1 with MDD = 20% may have five drawdowns during a month, while the strategy №2 with MDD = 40% may have only one such drawdown during the same period. What would you choose? To answer this question you need some more work to be done. Except considering personal risk attitude, finance and trading goals, it is essential also, firstly, to assess your strategies within several periods of time and preferably to rely on a big sample of trades. Secondly, to supplement your strategy assessment with other performance metrics. This way, you will have a complex analysis of your strategy. Find several steps of complex trading analysis in the following articles:
- Multiply the deposit via self-awareness (1)
- Multiply the deposit with the statistics analysis (2)
- Multiply the deposit with strategy optimization (3)
If you manage to find the drawdown you can handle, you ensure your survival in the market that means plenty of opportunities to recover and earn!
How to control MDD?
Logically, to reveal, manage, and monitor your drawdown, firstly, you need to have your trading statistics at hand. Thus, you can record the statistics either manually, or grab an opportunity of automated statistics and key performance metrics calculation in Bitinsure.
Secondly, reveal the maximum drawdown level for your strategy based on your previous performance, trading goals, risk tolerance, and so on. This will be the level that you won’t exceed in your trading to stay stably in the market.
Thirdly, monitor this level constantly either manually, or via automatic risk monitor in Bitinsure that will calculate the key performance metrics for you and send you an alert if any of the critical levels (e.g. maximum drawdown) set by you is reached. By the way, it is one of the means used by hedge funds to ensure stable profitability.
Finally, if, unfortunately, the maximum level of drawdown is reached, stop trading or/and correct your strategy (sometimes it’s even better not to trade for a while). Cut your losses and start a recovery process. Now you know your mistakes and won’t repeat them.
Done, magic, you benefit from your own losses!
In our next article, we will keep talking about the ways to assess your trading performance and will cover the core mistakes of 95% of newbies-traders, along with the ways to recover your deposit and increase profitability!
Stay tuned and join our social media:
Telegram: https://t.me/bitinsurecom
Facebook: https://www.facebook.com/bitinsure
Twitter: https://twitter.com/bitinsure_news
In this article we continue discussing key trading performance metrics that contribute to your trading strategy all-round assessment, resulting in crucial improvements and constantly increasing profitability.
What is essential to remind you from the previous article is that there are two pillars of successful progressive trading that are:
- Precise recording of trading statistics (manually and/or automatically),
- Calculation of additional trading performance metrics.
By completing these actions, you get an idea of your trading performance and a comprehensive picture of its efficiency via key trading metrics that provide you with valuable insights of your strengths and weaknesses. Among these metrics, there are profit factor (discussed in a previous article), maximum drawdown, total, and average net profit, etc. In this article, we are covering the maximum drawdown, one of the most essential risk assessment indicators.
Maximum drawdown (MDD) is a metric that means a peak-to-trough decline of your deposit (before a new high is reached) during a particular period of time. Simply, the maximum losses you suffered. It is calculated as:
And normally is presented in percentage. This way, we get a percentage of your overall losses from your maximum deposit before a new peak is reached. The metric tells us about a risk level of your strategy and it is a must for adequate trading strategy evaluation because drawdowns are natural for trading. Any winning strategy includes losses! Your business here is to evaluate and control them in a way to increase your profits. And MDD is one of the tools to do this.
To illustrate, you started trading with a deposit of $100,000. You were quite successful and increased the deposit to $120,000. After that, you had some fluctuations with the minimum value of $70,000. Finally, you managed to gain and now have a deposit of $140,000.
In this case, the maximum drawdown is:
MDD = ($120,000- $70,000) / $120,000 = 41.67%
To clarify, we included into a formula a peak of $120,000 as the maximum value before the deposit reached its lowest point – $70,000. We do not consider a maximum peak of $140,000 in this calculation because it is a new maximum reached after the lowest value. As for $80,000 and $110,000 points, they are ignored as they are not the peaks or lows within this period.
So, this MDD means that the maximum loss you suffered from your maximum deposit was 41.67%. The question is if this number is normal?
How to assess MDD?
There is no clear answer, as the MDD assessment is closely related to your trading aims, strategy, deposit and risk tolerance. Hence, with these things kept in mind, regard the following issues that are the core while assessing MDD of the strategy:
- Drawdown magnitude. Be it 5% or 50%, evaluate if you can survive with this risk amount financially and morally to continue trading and earning? There are no earnings without survival! It’s essential.
- Drawdown duration. Pay attention to the time this drawdown lasts. A week and a year of drawdown make a difference. Decide if you will remain solvent during this period of time.
For your help: Generally, the max drawdown of 20% is considered to be an average normal (not that painful) value for the majority of traders, but it depends a lot.
However, take into account that MDD measures the overall largest loss without revealing the frequency of such losses. For instance, the strategy №1 with MDD = 20% may have five drawdowns during a month, while the strategy №2 with MDD = 40% may have only one such drawdown during the same period. What would you choose? To answer this question you need some more work to be done. Except considering personal risk attitude, finance and trading goals, it is essential also, firstly, to assess your strategies within several periods of time and preferably to rely on a big sample of trades. Secondly, to supplement your strategy assessment with other performance metrics. This way, you will have a complex analysis of your strategy.
If you manage to find the drawdown you can handle, you ensure your survival in the market that means plenty of opportunities to recover and earn!
How to control MDD?
Logically, to reveal, manage and monitor your drawdown, firstly, you need to have your trading statistics at hand. Thus, you can record the statistics either manually, or grab an opportunity of automated statistics and key performance metrics calculation in Bitinsure.
Secondly, reveal the maximum drawdown level for your strategy based on your previous performance, trading goals, risk tolerance and so on. This will be the level that you won’t exceed in your trading to stay stably in the market.
Thirdly, monitor this level constantly either manually, or via automatic risk monitor in Bitinsure that will calculate the key performance metrics for you and send you an alert if any of the critical levels (e.g. maximum drawdown) set by you is reached.
Finally, if, unfortunately, the maximum level of drawdown is reached, stop trading or/and correct your strategy. Cut your losses and start a recovery process. Now you know your mistakes and won’t repeat them.
Done, magic, you benefit from your own losses!
In our next article, we will keep talking about maximum drawdown and will cover the core mistakes of newbies-traders related to it, along with the ways to recover your deposit and increase profitability!

